ghostlines
ghostlines was originally by far the least performant of my RC creative coding experiments, clocking in around 5 seconds per frame. However, I cleaned it up after drafting this blog post and got it down to 80-200ms today without even using Pyodide! More on that at the end.
Concept
The Creative Coding prompts this day were “use lines wisely” (I used them quite unwisely), “self-portrait”, and “look deep into the void”. I decided I wanted to draw a sort of ghostly trace of pixels that had moved between frames.
The intuitive first thought was to draw the trace of every “object” that had moved between frames, but clustering pixels and identifying them as objects is a pretty heavyweight ML problem, which I tend to avoid in favor of old-school vanilla computation. I would expect this approach to also be a bit chaotic (but in an interesting way) because of the possibility of line crossings, depending on the exact implementation.
First draft
Motion of “mass” in an image
The approach I came up with was to draw red lines representing the movement of the image’s center of “mass”, from a sample of points which had “moved”. Now to figure out what that actually means in practice.
Center of “mass” of an image
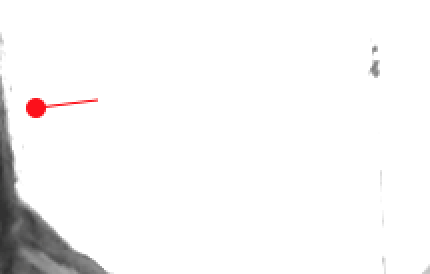
Once we know the CoM for each captured frame, we can then draw a bunch of vectors (represented as red lines) pointing in the direction of the change of CoM between frames.
I first greyscaled everything for simplicity. I then decided to treat dark pixels as “mass”, and light pixels as lack of “mass”. In other words, flip the numerical values so I’m counting 0 (black) as the high value, 256 (white) as the low value.
My visual center of “mass” calculation, paraphrased for context:
function getCenterOfMass(image) {
  matrix = getInverseGreyscaleMatrix(image);
  m = 0;   // total mass
  cx = 0;  // X-center of mass
  cy = 0;  // Y-center of mass
  for (y in range(matrix.length)) { // row
    for (x in range(matrix.width)) { // col
      m += matrix[y][x];
      cx += matrix[y][x] * x;
      cy += matrix[y][x] * y;
    }
  }
  return [Math.round(cx/m), Math.round(cy/m)]
}
Basically, I find the X-center and Y-center, and normalize them by total mass to get the X-Y coordinates of the 2D center of mass. I can then get the vector of change between frames by calculating Euclidean distance between two CoMs.
Side note: inverse greyscale matrix
I also had a delightful time using lodash to write a very FP approach to getting the inverse greyscale matrix representation of a full-color image.
// Get 2d matrix containing just greyscale values at each RGBA pixel,
// inverted so that black=high, white=low
function getInverseGreyscaleMatrix(im) {
  return _.chunk(
    _.map(
      // Chunk the 1D list into RGBA 4-tuples
      _.chunk(im.data, 4),
      // Invert values
      (p) => (255 - _.min(p.slice(0,3))),
    // finally, reshape into a width x height 2D array
    ), im.width,
  );
}
For context, image data from the Canvas API in Javascript is provided as a 1-dimensional array of flattened RGBA pixel values: [r, g, b, a, r, g, b, a, ...]. However, I get to ignore the A (alpha) value, because I’m not using transparency.
I chunked each set of 4 values together, iterated over them, and grabbed the B&W value of each RGB-tuple, but inverted. I finally reshape into a 2D array of B&W values.
Finding points that “moved”
An 800x600 image has 480k pixels, so even if only 5% of those pixels “move”, I definitely want to downsample them a lot, lest my entire screen be a mass of red lines.
I first calculated which pixels had changed values between sampled frames. Because many changes are relatively imperceptible and because webcam metering frequently changes between frames anyways, I ended up picking a threshold requiring a 40% change in B&W value.
Even this was too cluttered, as I was still getting tens of thousands of moved points between frames where I wasn’t sitting perfectly still. I raised the bar even more, giving each point a 1% chance of being sampled.
Drawing the “motion”
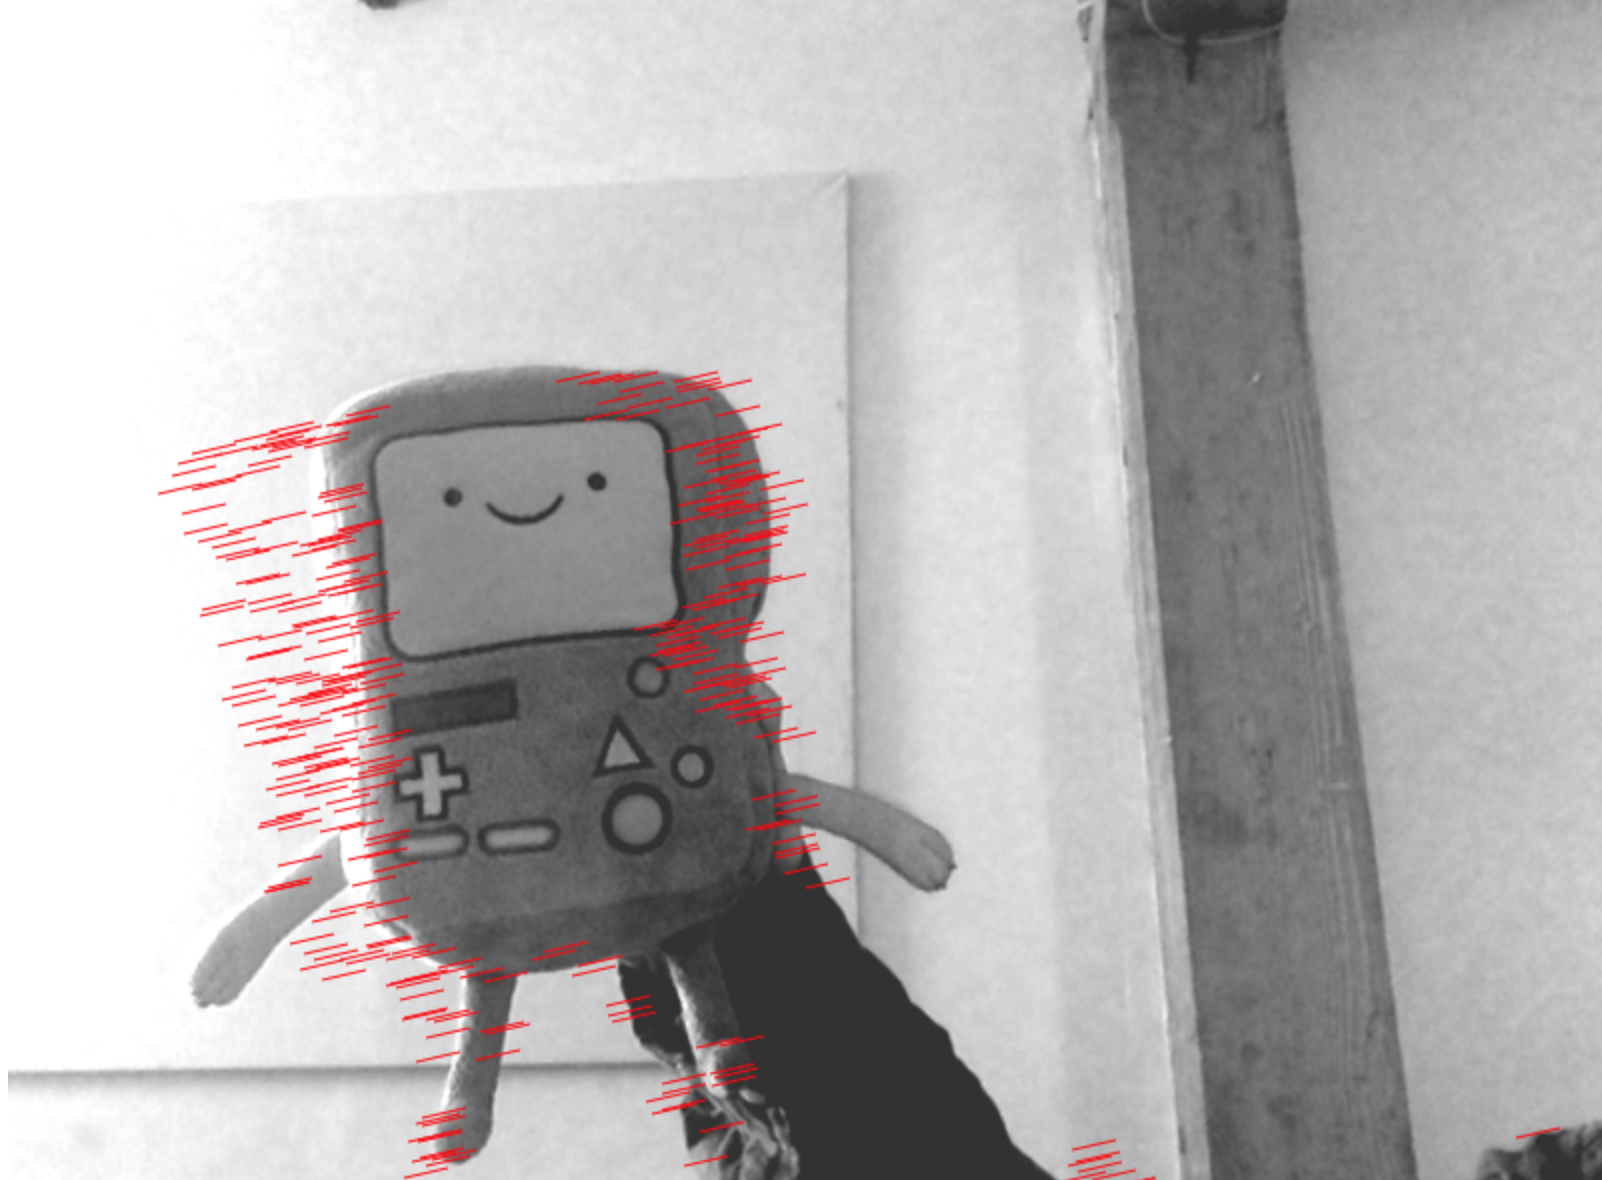
Finally, using the canvas API, I then drew a bunch of vectors (represented as red lines), starting at each sampled coordinate that had registered a change, and pointing in the direction of the change in center of mass of the image.
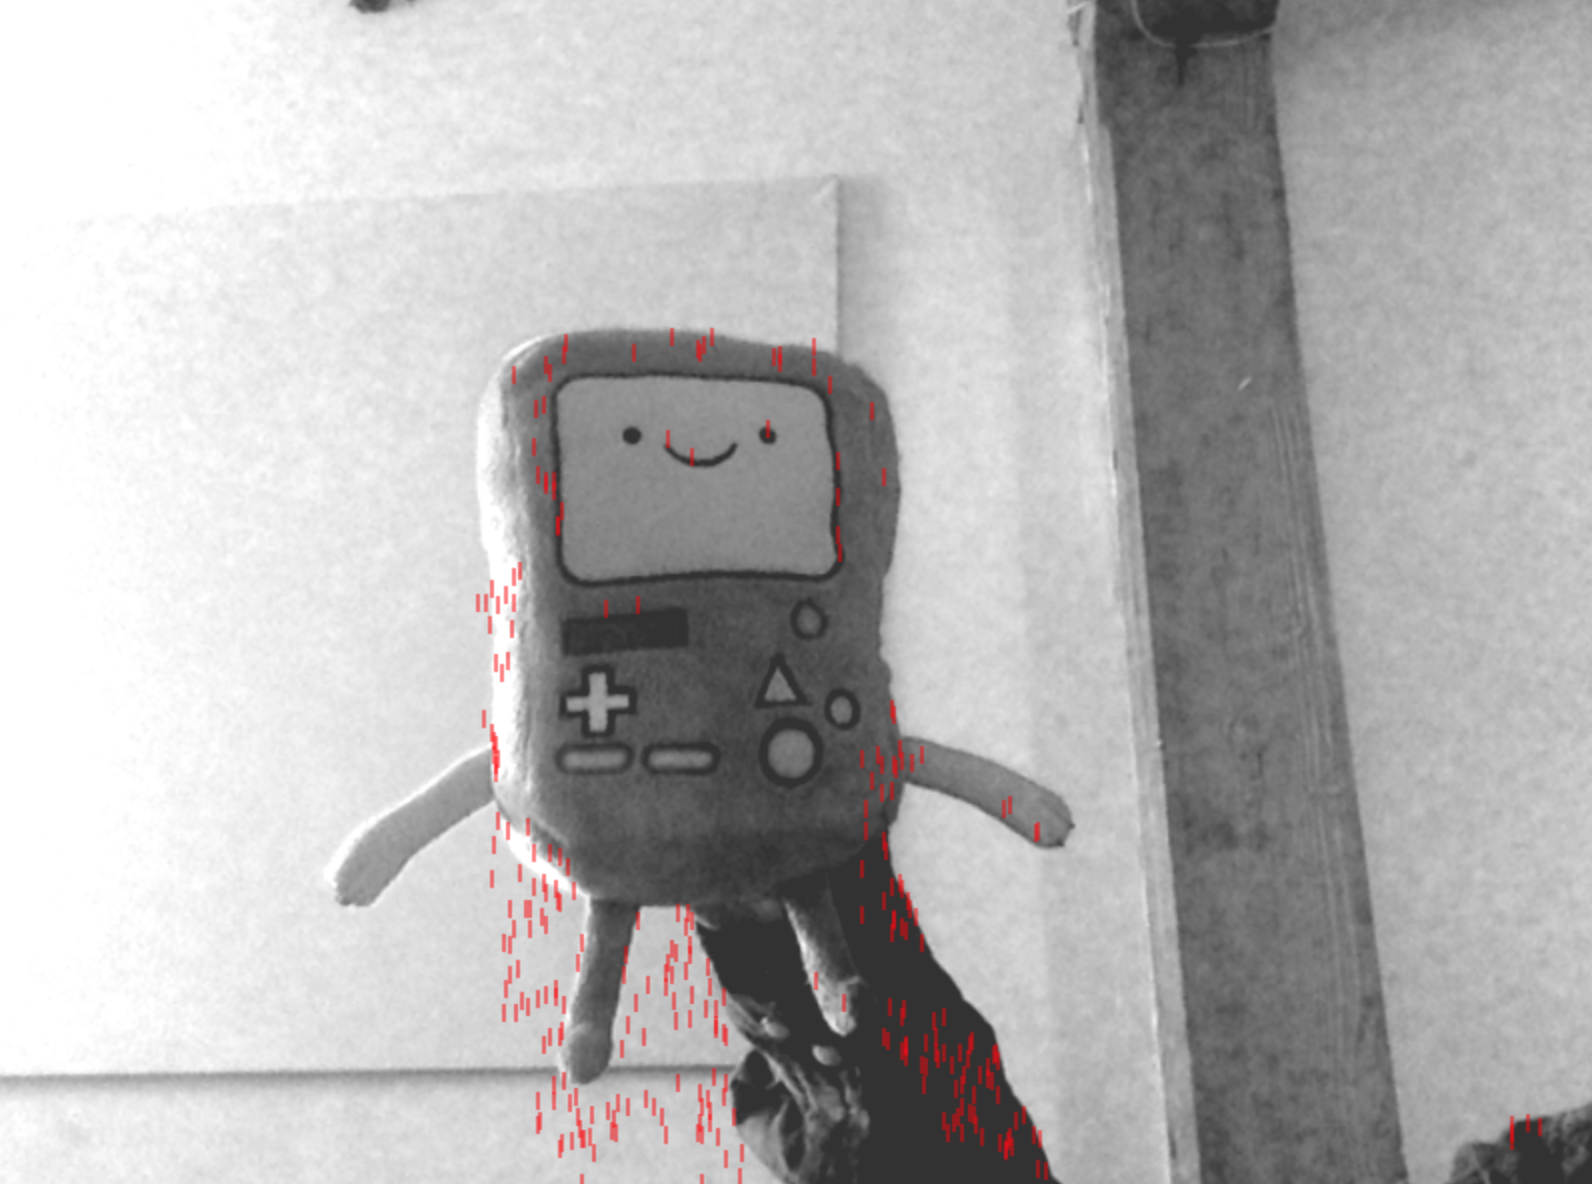
And there you have it! Ghostly ghost lines.
Performance optimization
The original ghostlines was painfully slow, barely rendering at around 3-8 seconds per frame. After writing the first half of this blog post and feeling sad about performance, I looked at the code again and found a vast hoard of funky efficiency issues (a natural side effect of speed-drafting and iterative changes) to fix up.
Functional programming is cute, but side effects are not
It turns out I was storing a lot of duplicate or intermediate representations of the image data, which, at 480k pixels, is Quite A Lot of work for my sad web client. That cute inverse greyscale matrix I was talking about earlier? Very slow to stash in memory.
By looking at already-in-memory image data instead of calculating a fresh matrix, I made the center of mass calculation 500x faster (dropping from 1000ms to ~2ms), and got a 3x speedup on getDiffCoords(...), the function that samples the pixels which seem like they have changed.
Drawing lines in bulk
I had overlooked that my line-drawing was not optimized for bulk lines. I was doing this for each individual line.
ctx.beginPath();
ctx.moveTo(...);
ctx.lineTo(...);
ctx.strokeStyle = ...
ctx.stroke();
Like a SQL commit, it is unnecessary to reinstate beginPath() and stroke() so often; you only need to do it at the beginning and end of a bulk set of transactions, or in this case, a bulk set of lines to draw at once.
ctx.beginPath();
for (lineCoords in allCoords) {
  ctx.moveTo(...);
  ctx.lineTo(...);
}
ctx.strokeStyle = ...
ctx.stroke();
Surprisingly, this did not give me a particularly noticeable speedup – I wonder if there was some preoptimization happening in my interpreter?
Speed up sampling
I was being terribly foolish with my order of operations in getDiffCoords(...). First, I was iterating over all possible 480,000 pixels to see which ones met my criteria, and then sampling out of those.
I sped this up 300x (dropping from ~1000ms to 3ms) by first taking a random sample of possible coordinates, and then seeing which of those met my criteria.
Refactor out remaining intermediate representations.
Following up from my first refactor, I picked through the code and refactored out a bunch of places where I was unnecessarily storing intermediate representations when I could instead be operating in-place on the existing image data.
This made my initial setup/processing 5x faster, dropping several hundred milliseconds. By now I was hovering around 150-250 milliseconds, which was pretty good, but then I found one more thing.
Getting rid of array slices
When profiling, I saw that the greyscaling filter was taking 80ms, while the brighten & contrast filters took under 2ms. Since these operations are mathematically similar, this sounds like probably another execution performance issue with array allocation.
I found an intermediate array slice was getting taken N_PIXEL times, and got rid of this so I was indexing directly into im.data.
Before:
function filterBW(im) {
  for (let i=0; i<im.data.length; i+=4) {  // rgba 4-tuple
    let v = _.max(im.data.slice(i, i+3));
    im.data[i] = im.data[i+1] = im.data[i+2] = v;
  }
}
After:
function filterBW(im) {
  for (let i=0; i<im.data.length; i+=4) {  // rgba 4-tuple
    let v = _.max([im.data[i], im.data[i+1], im.data[i+2]]);
    im.data[i] = im.data[i+1] = im.data[i+2] = v;
  }
}
This seemingly trivial change took my greyscale filter down from 80ms to basically nothing (1-2ms). Gotta be careful with those slices!
Dead ends with the Canvas API
I also looked into the canvas drawing/capturing time. If you look at my source, one weird thing you might notice is that there are two separate canvases, each of which gets drawn once per captured frame. Apparently, this is a necessary intermediate step of capturing a frame from a video object, and there is no (accessible) way around it other than mucking directly with your GPU.
This frame capturing step is taking 20-60ms in most cases, but occasionally shoots up to 200ms. So that accounts for the bulk of the remaining time. The math, redrawing, and line-drawing are now only taking around 5-10ms.
Summary
In summary, I brought this sketch down from several seconds per frame to around 5-15fps (“good enough”) mostly by getting rid of intermediate data representations, considering operations that were unnecessary in context or in bulk, and swapping around the orders of some operations.
Unfortunately, my code became much less encapsulated as a result, but I left (hopefully) copious enough comments that I won’t forget why some of it looks odd if I return to this in the future.
Good times, I love perf optimization!